RAMP / Remote Asset Management Platform
Making a five-system alert chain operable
RAMP brings telemetry, alarm logic, SAP APM, and Grafana context into one operating surface for validating alerts, documenting findings, and creating maintenance notifications. I led design from discovery through UAT and production, then extended the work into alert traceability and diagnostics.
⟦Ŕëšüľţ ·⟧
Took the alert-handling experience from discovery through UAT and production. RAMP 360 extended the research into missing-alert diagnostics.
5
technical layers translated into one alert-handling workflow
- ⟦Ÿëáŕ ·⟧
- 2024–26
- ⟦Ḿÿ šçöþë · ·⟧
- Design lead from discovery through UAT and production across alert triage, mobile and fixed-plant workflows, responsive specifications, and RAMP 360 research.
- ⟦Çöľľáƀöŕáţöŕš · ·⟧
- Product and engineering partners, telemetry and alarm-logic specialists, SAP APM stakeholders, equipment subject-matter experts, and operations users. Engineering owned implementation and system architecture.
One alert, five systems
An equipment alert can begin as sensor or OEM data, pass through a telemetry platform and an action engine, carry context from SAP APM and Grafana, and end in RAMP, where somebody has to decide whether the issue is real and what happens next.
Each layer owns a different part of the truth. Telemetry knows what arrived. Alarm logic knows what qualified. SAP APM knows the maintenance object. Grafana knows what the signal did over time. RAMP has to turn all of that into an action a person can complete without reconstructing the chain first.
The product problem was not another dashboard. It was a reliable handoff between systems with different identifiers, states, owners, and failure modes.
The interface had to make a distributed technical process feel like one accountable workflow.
Researching a workflow no one person owned
There was no single subject-matter expert who could explain the complete workflow. I worked across the people who owned telemetry, alarm configuration, maintenance records, monitoring, and day-to-day alert review, then mapped where their explanations agreed and where they did not.
Discovery combined a screen-by-screen audit of the legacy interface, Grafana dashboards, and the spreadsheet used for weekly review with focused sessions around the decisions each role had to make. The recurring jobs were configuring alarms, refining thresholds, reducing false positives, validating telemetry, and moving alerts through an accountable state model.
That research changed the information architecture. The product separated fleet, alerts, mobile equipment, fixed plant, approvals, and database management because those areas have different objects and permissions, even when they share the same status language and table patterns.
Designing the queue for action
The alert queue separates workflow status from severity. New and In Process describe what the team has done. Warning and Error describe what the equipment signal means. Combining them into one color scale would make an urgent alert look complete or an ordinary alert look dangerous, so both systems remain visible in every row.
Live Stream, Pending, Closed, and an explicitly unavailable Errors state frame the queue over time. Counted, dismissible filter chips preserve the current query, while two-line cells pair a machine fault code with a plain description and an asset identifier with its resolved name. Missing links and unresolved names are designed states rather than data defects hidden from the layout.
Direct alert handling moved notification creation and status management into RAMP instead of requiring the user to leave for SAP APM. That reduced a tool dependency without pretending the underlying maintenance system had disappeared.
Severity describes the machine. Workflow status describes the team. The queue has to show both.
Making design traceable to delivery
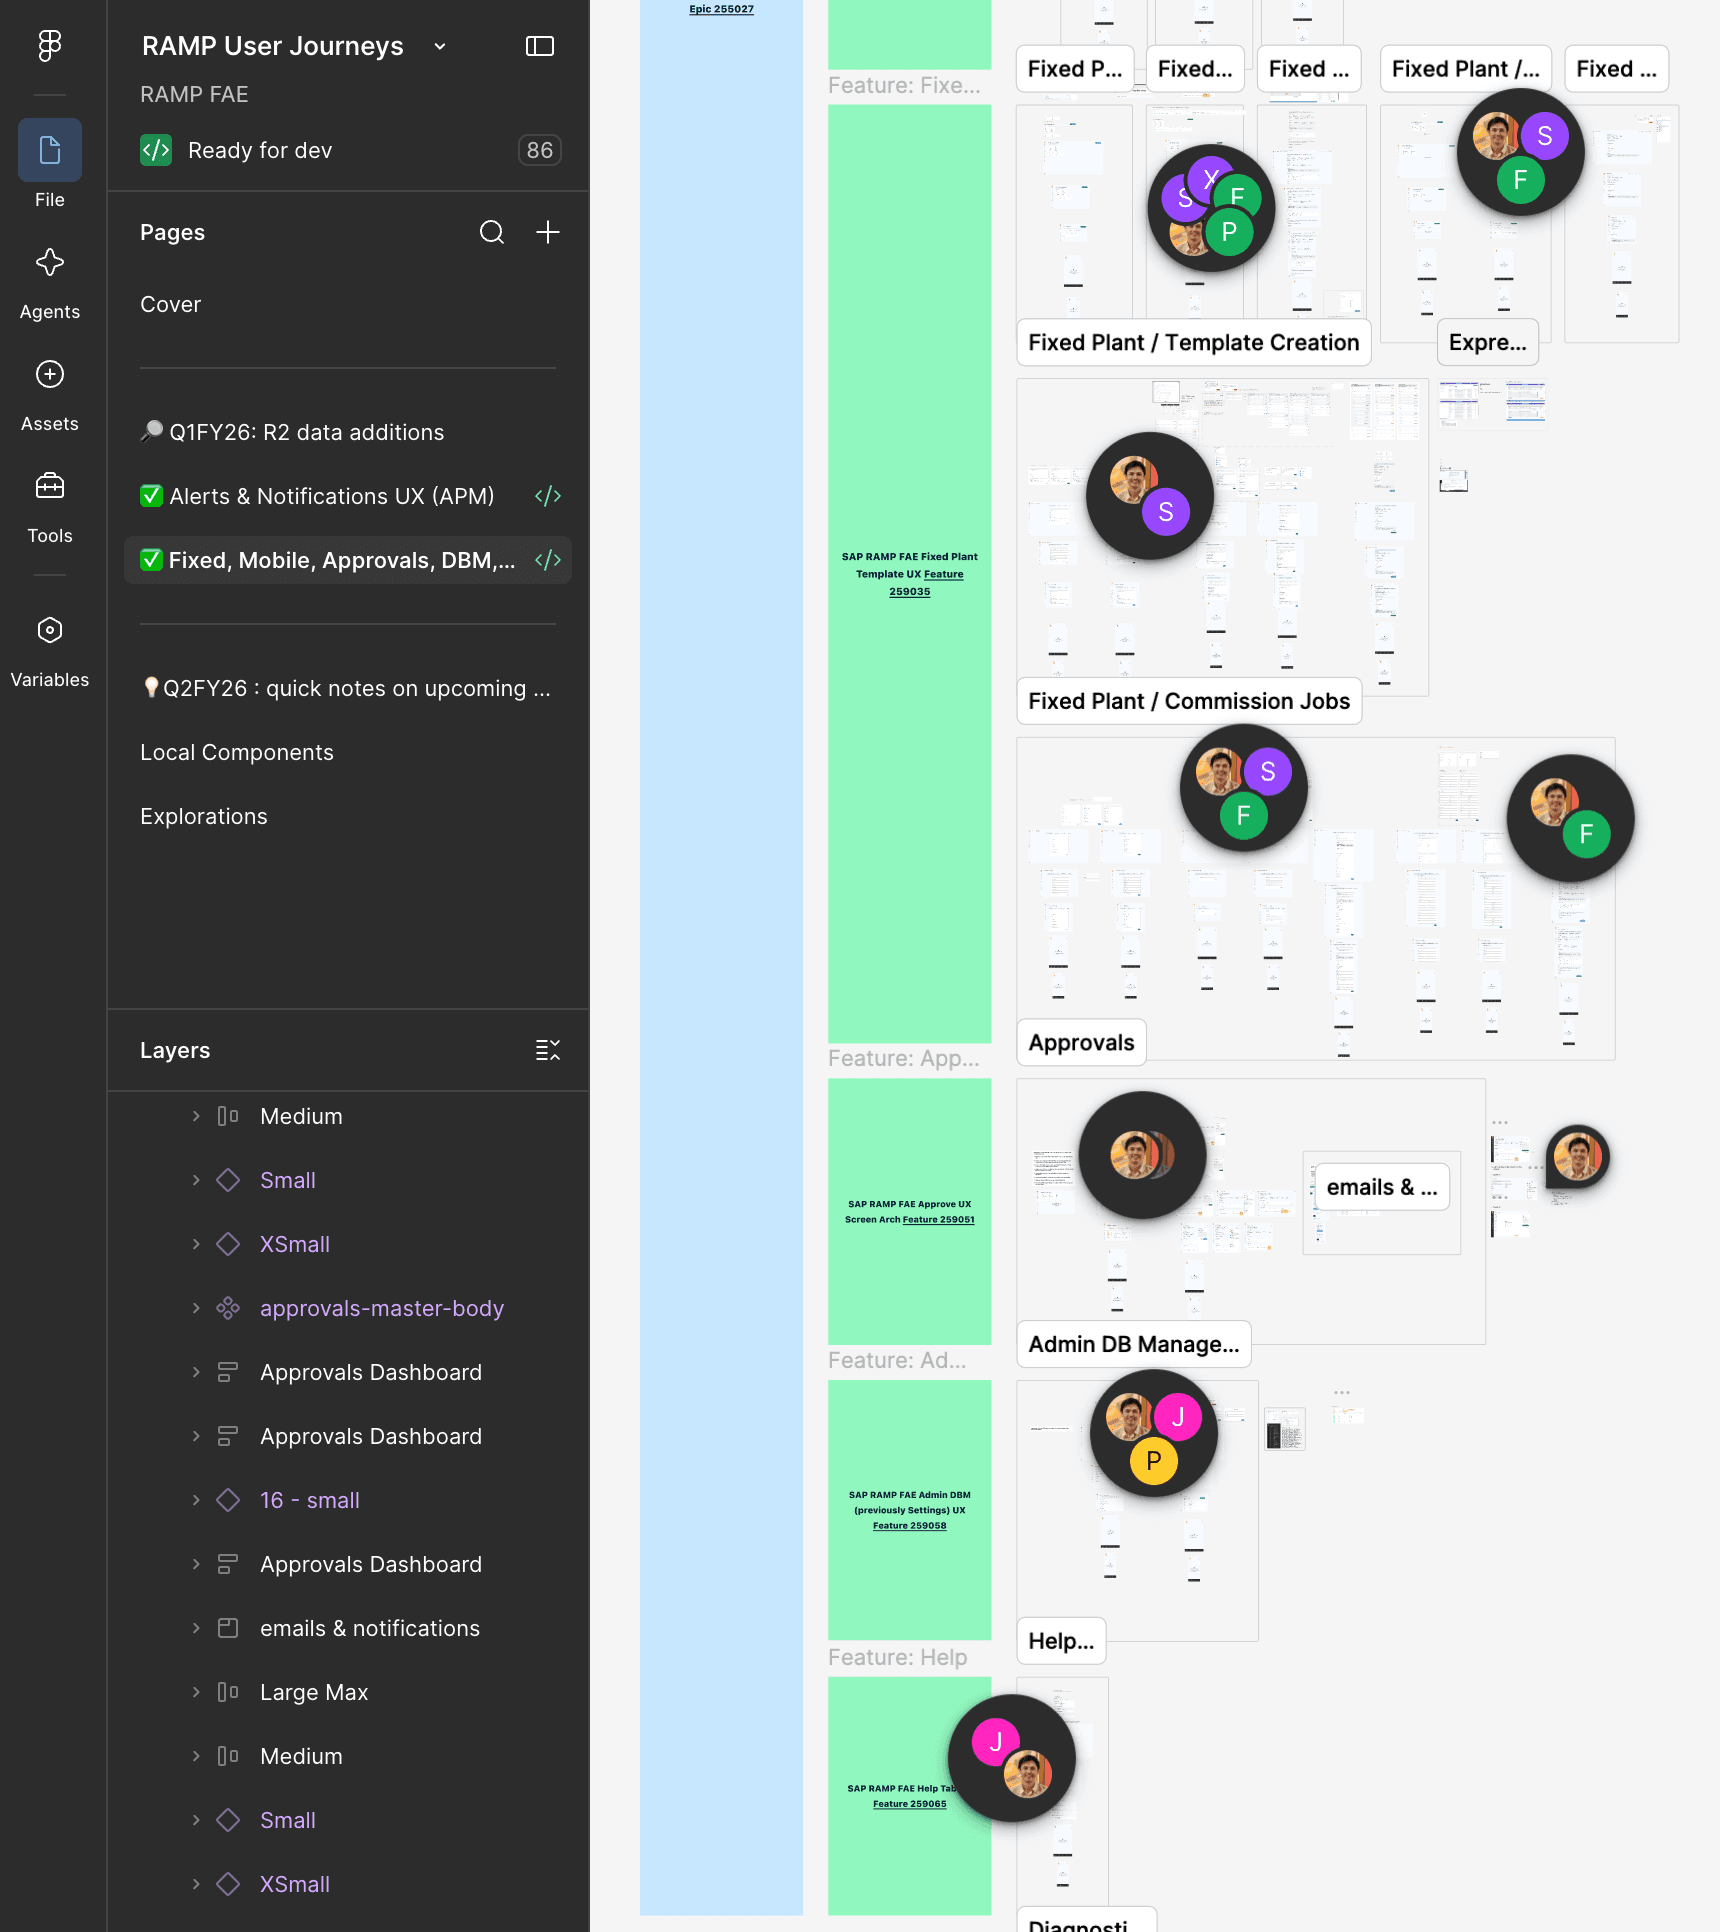
The MVP design file was organized as the delivery backlog. Epic and feature lanes map to responsive user journeys, and the same screen is specified at large, medium, small, and extra-small widths. Eighty-six frames were marked ready for development in the captured working file.
That structure made scope visible to engineering and kept fixed plant, mobile equipment, approvals, database management, and notification work from becoming separate visual systems. Shared table behavior, filters, status tokens, and navigation patterns could be reviewed once and applied across the product.
I led the product design from concept through UAT and into production. Engineering owned the implementation, while I worked through responsive behavior, edge cases, review feedback, and the interaction details required to make the operating workflow coherent.
When an alert never arrives
RAMP 360 began with a question the original queue could not answer: if an eligible alert never appeared, where did it stop? A missing row could mean the signal was ineligible, the alarm logic did not run, a processor failed, a downstream system rejected the record, or the experience never received it.
The research split the answer into two levels. Operations needs a simple health view showing whether alerts were evaluated, processed, and delivered. Technical specialists need the detailed trace, identifiers, timestamps, failure point, and diagnostic history required to repair the chain.
Keeping those levels separate avoids turning an operations product into a log viewer while still giving specialists a route to evidence. The unresolved questions were as important as the proposed interface: which counts are authoritative, which errors are resolvable, who owns each failure, and how long diagnostic history should persist.
A missing alert is not one failure. It is a question about which system last knew the truth.
Delivery and the next measurement step
RAMP moved from discovery through UAT and into production with alert triage, mobile and fixed-plant workflows, approvals, database management, responsive specifications, and direct alert handling represented in the product and delivery file.
The public evidence supports the workflow, the designed states, the delivery structure, and the move away from SAP APM-dependent alert handling. It does not support a quantified reduction in response time, false positives, maintenance cost, or downtime.
If I returned to the product measurement plan, I would instrument time to acknowledge, time to resolve, false-positive disposition, filter reuse, cross-system failure rate, and the percentage of eligible alerts with a complete trace. Those measures would show whether the interface improved the operation rather than only reorganized it.
◆⟦Đëçïšïöñš · ·⟧
⟦Ţĥë đëçïšïöñ · ·⟧
Move alert handling, notification creation, and status management into RAMP instead of keeping SAP APM as a required step in the operator workflow.
⟦Ţĥë ţŕáđëöƒƒ · ·⟧
RAMP had to model maintenance states and validation rules that previously belonged to another system. That increased product scope and created another integration surface to maintain.
⟦Ţĥë çöñšëqüëñçë · · ·⟧
The user could review and act on an alert in one operating surface while SAP APM remained the underlying maintenance system. The dependency moved out of the interaction path rather than being described as eliminated.
⟦Ţĥë đëçïšïöñ · ·⟧
Keep workflow status and equipment severity as two independent state systems in the alert queue.
⟦Ţĥë ţŕáđëöƒƒ · ·⟧
Every row carries more visual information, and two amber treatments can compete if hierarchy is weak. A single status pill would be quieter and easier to implement.
⟦Ţĥë çöñšëqüëñçë · · ·⟧
A reviewer can distinguish what the machine reported from what the team has done without opening the row. Urgency and accountability remain separate, which prevents one from overwriting the other.
⟦Ţĥë đëçïšïöñ · ·⟧
Give operations a simple delivery-health view and technical specialists a separate detailed trace instead of exposing the full diagnostic chain to everyone.
⟦Ţĥë ţŕáđëöƒƒ · ·⟧
Two levels require an escalation path, role-aware permissions, and agreement about when the summary is no longer enough. One universal diagnostics screen would have been cheaper to build.
⟦Ţĥë çöñšëqüëñçë · · ·⟧
The RAMP 360 research defined a summary for operations and a detailed trace for specialists. Diagnostic ownership and authoritative counts remained open questions for implementation.
Complex workflowsObservabilityEnterprise productInformation architectureResponsive design